QittaのR言語記事を散策していたら@roadricefieldさんの面白い記事があったので、自分でも解いてみることにしました。
問5
極値を求める関数を作成する問題。
関数
extremum_detector <- function(d, k){
  # 補助関数
  f <- function(a,k){
    judge <- rep(c(1,-1),each=(k-1)/2)
    sdf <- sign(diff(a))
    all(sdf == judge)||all(sdf == rev(judge))
  }

  if(k < 3 || k %% 2 == 0) stop()
  # extremum pointを返す
  which(apply(embed(d,k),MARGIN=1,f,k)) + (k-1)/2
}
実行
5点近傍での極値
dev.off()
data <- c(1, 2, 3, 2, 1, 0, 1, 0, -1, 2, 3, 2, 1)
extremum.points <- extremum_detector(data, 5)
plot(data, type="b")
points(extremum.points, data[extremum.points],col = "red",pch=16)

3点近傍での極値
dev.off()
data <- c(1, 2, 3, 2, 1, 0, 1, 0, -1, 2, 3, 2, 1)
extremum.points <- extremum_detector(data, 3)
plot(data, type="b")
points(extremum.points, data[extremum.points],col = "red",pch=16)

コメント
embed関数なるものを使うと、系列を左から個ずつスライドして取り出すことができて便利(ただし順番が逆になる点のみ注意)
- 使用例
> letters[1:12]
 [1] "a" "b" "c" "d" "e" "f" "g" "h" "i" "j" "k" "l"

> embed(letters[1:12],4)
      [,1] [,2] [,3] [,4]
 [1,] "d"  "c"  "b"  "a"
 [2,] "e"  "d"  "c"  "b"
 [3,] "f"  "e"  "d"  "c"
 [4,] "g"  "f"  "e"  "d"
 [5,] "h"  "g"  "f"  "e"
 [6,] "i"  "h"  "g"  "f"
 [7,] "j"  "i"  "h"  "g"
 [8,] "k"  "j"  "i"  "h"
 [9,] "l"  "k"  "j"  "i"
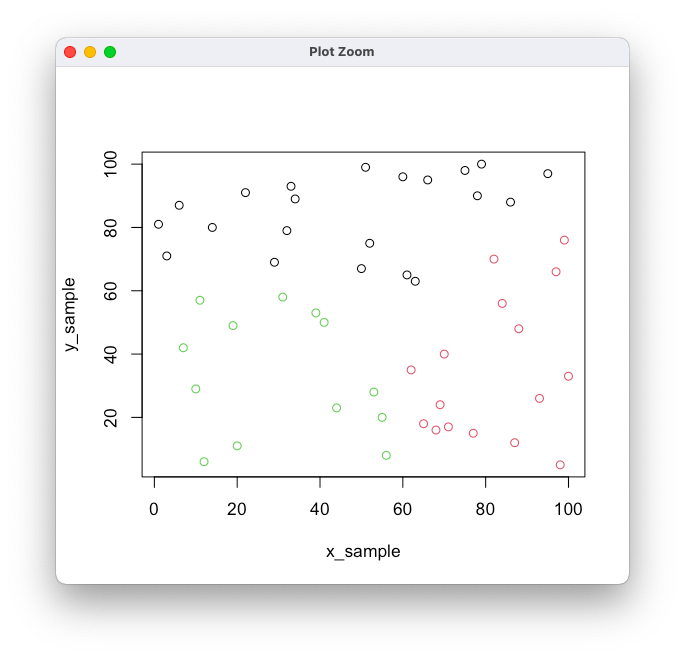
問6
k-meansクラスタリングを実装する。
関数
my_kmeans <- function(x = x_sample, y = y_sample, k = 3){
  # # 初期クラスタを選択
  # cent_ind <- sample(seq_along(x), k, replace = FALSE)
  # # 初期セントロイドたち
  # cent     <- cbind(x[cent_ind], y[cent_ind])
  # cent     <- cbind(c(91,57,41),c(26,61,14))

    cent     <- sample( (min(x,y)):(max(x,y)), k * 2, replace = FALSE) |> matrix(nrow = k)
  i <- 0
  while(1){
    # セントロイドからの距離が最小となるような所属を求める
    M <- rbind(cent, cbind(x,y)) |> dist() |> as.matrix()
    belong <- M[-(1:k),1:k] |> apply(MARGIN = 1, which.min)

    # 新しいセントロイド
    cent_new <- cbind(tapply(x, belong,  mean), tapply(y, belong,  mean))
    i <- i+1
    cost <- sum((cent_new - cent)^2)
    print(paste("iter = ",i,", cost = ", cost))

    # costが1より小さかったらループ終了
    if ( cost < 1 ) break

    # セントロイドの更新
    cent <- cent_new
  }

  # 所属を返す
  return( belong |> as.numeric() )
}
実行
dev.off();
set.seed(2022)
x_sample <- sample(1:100, 50, replace = FALSE)
y_sample <- sample(1:100, 50, replace = FALSE)
clst <- my_kmeans(x_sample, y_sample, k = 3)
plot(x_sample, y_sample, col = clst )